The different layers, both individually and when taken as an aggregate, result in a visual representation of resilience to climate change as a conflict factor (see §2.3) and the varying degrees of risk involved. The legend of the monitor is divided into three different colors: green, yellow and red. The greener a country is, the lower their score. To policymakers and business professionals alike, it is expected that obtaining a greener shade is more desirable as this represents a greater degree of wellbeing. The more red a country is, the higher their score. Red is therefore an undesirable color, as this illustrates high vulnerability, high risk and low resilience. Yellow implies that a country is in the medium range. It is advisable to the reader to go through the subsequent text while looking at the monitor.
Layer One: Conflict Vulnerability Analysis
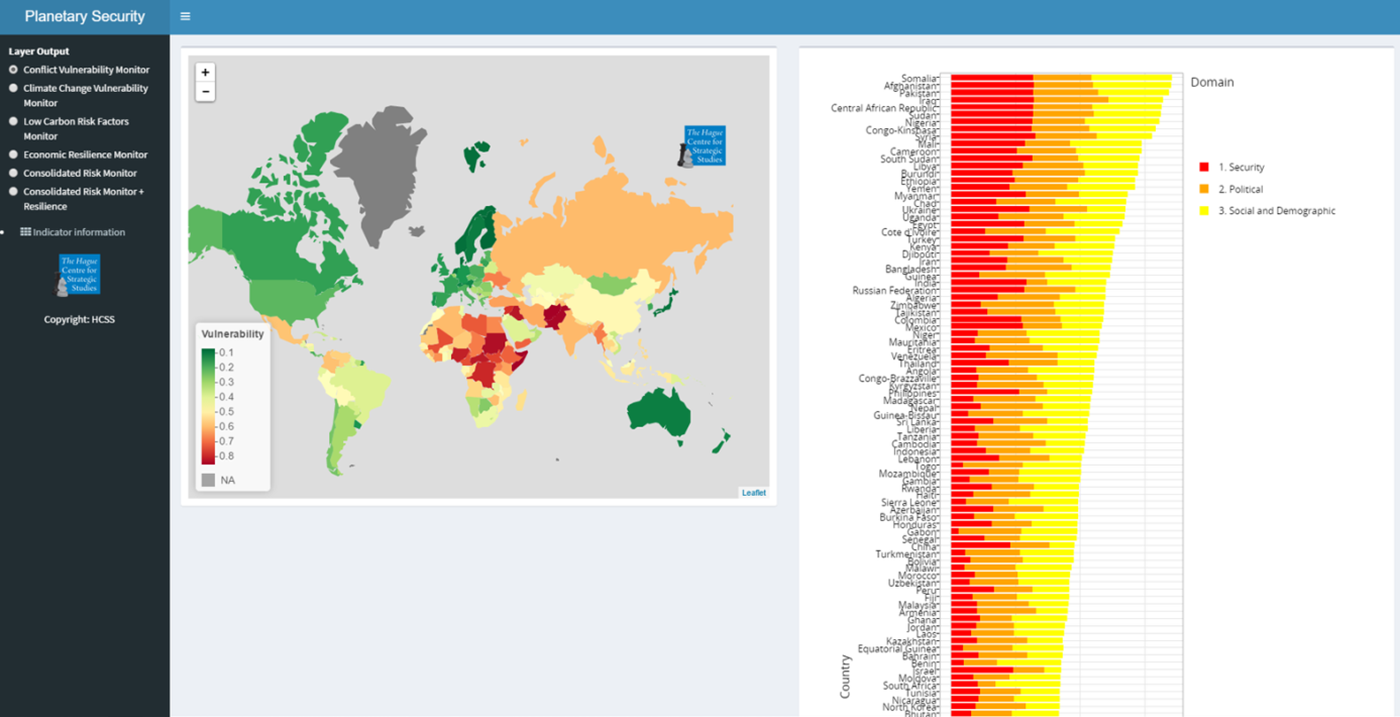
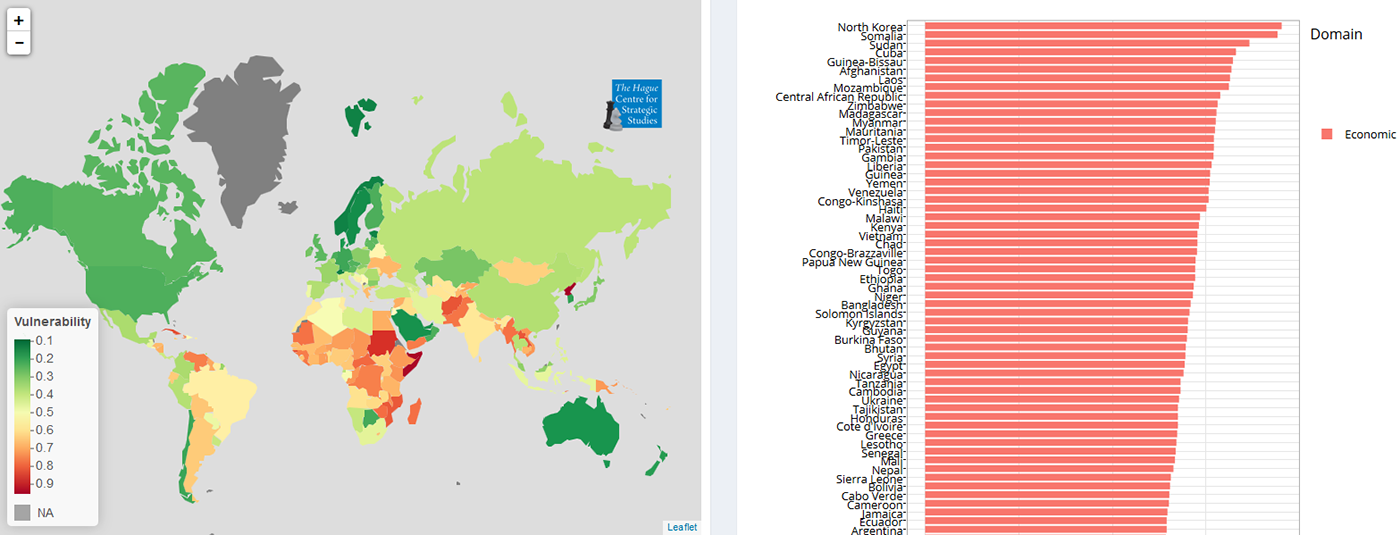
Looking at the monitor it becomes apparent that most of the Global North is less vulnerable to conflict in comparison to the Global South. At face value, it seems that the most vulnerable countries are centered in the Middle East and Africa – this is arguably due to the fact that these regions suffer from ongoing conflicts. The majority of these conflicts are not interstate, but rather between insurgent non-state actors against the state or among themselves. Indeed, the changing nature of international warfare as previously outlined in paragraph 2.1, has been characterized by this rise in non-state insurgencies, and this is particularly pertinent to the results of these datasets.
Overall, much of the African continent ranges in the Medium to high vulnerability range, with Namibia and Botswana as the only outliers with low conflict vulnerability. This is in stark contrast with Sub-Saharan Africa, and the Sahel regions, which score high on conflict vulnerability range. Europe – and Scandinavian countries in particular – have low scores on the vulnerability range, having no recent or current conflict recorded. A similar situation can be seen in North America, where the USA and Canada, followed by Panama, score low on the vulnerability range, while Caribbean states range in the medium vulnerability area. Latin American countries, save for Columbia and Venezuela, display low vulnerability. Mongolia, Australia and Japan, also score quite low, making them regional outliers in Asia and Oceania.
Top Ten: Countries ranked most vulnerable
|
Rank |
Country |
Overall Score |
|---|---|---|
|
1 |
Somalia |
0.851 |
|
2 |
Afghanistan |
0.850 |
|
3 |
Pakistan |
0.843 |
|
4 |
Sudan |
0.834 |
|
5 |
Iraq |
0.822 |
|
6 |
Central Africa Republic |
0.815 |
|
7 |
Nigeria |
0.805 |
|
8 |
Congo DR |
0.793 |
|
9 |
Syrian Arab Republic |
0.776 |
|
10 |
South Sudan |
0.752 |
The top ten most vulnerable countries are predominantly located in the MENA region. All of these countries are experiencing some form of insurgency or internal conflict. The degree of vulnerability along the top ten increases gradually, with Somalia having a 0.001 increase to Afghanistan, and having approximately a 0.01 increase to South Sudan, indicating that the degree of vulnerability across the top does not vary too much.
Considering that some of this data is taken from 2014, Iraq and Syria are expected to score more highly in future monitors with the rise of ISIL, Kurdish insurgencies and other militias within their borders. Additionally, most of these countries score highly in the security sub-domain, meaning that when normalizing the data across the three sub-domains, much of the data produced here is considerably higher than that in the other sub-domains (political and socio-demographic). This means that they are more unstable. Potentially, as a result of the regional climate and its geopolitical importance, Turkey will score higher in the security sub-domain in the near future due to its recent increase in domestic conflict.
Bottom Ten: Countries ranked least vulnerable
|
Rank |
Country |
Overall Score |
|---|---|---|
|
1 |
Finland |
0.073 |
|
2 |
Denmark |
0.085 |
|
3 |
Norway |
0.087 |
|
4 |
Japan |
0.095 |
|
5 |
Netherlands |
0.103 |
|
6 |
Sweden |
0.106 |
|
7 |
Australia |
0.109 |
|
8 |
Slovenia |
0.115 |
|
9 |
New Zealand |
0.118 |
|
10 |
Austria |
0.121 |
The lack of conflict in Europe, most notably in Northern Europe – with all Scandinavian countries represented in the bottom ten overall (occupying the top three positions in Table 7) - is one of the main reasons that the least vulnerable countries are Euro-centric, with the exceptions of Japan, Australia and New Zealand. The variance across the bottom ten highlights that there is not much difference in the degree of vulnerability across these datasets. Considering that most of these countries are lauded for their high quality of life[59] – namely Denmark, the Netherlands and Austria – and for their respective welfare systems in place, the extremely low scores in the socio-demographic subdomain and the political subdomain (see annex) might explain their low overall scores.
Consideration one: conflict intensity in the MENA region
From the data set, there is an evident correlation between countries who score highest in the Layer One Security subdomain, and those who score highest overall. The security sub-domain consists of indicators that include: maximum conflict intensity, the global terrorism index, political terror scale, refugees produced and best estimate from state based violence (see Annex 1). Consequently, it is unsurprising to find that conflict zones score the highest in this subdomain, with several MENA countries occurring in the top 20. This is indicative of the overall impact of conflict intensity in the MENA region. With many MENA governments playing an active role in quelling domestic insurgent groups, in particular the Syrian and Iraqi governments, it calls into question how conflict vulnerability can be mitigated from a policy viewpoint, especially when considering if a central government’s grip on power is dwindling. This paints a bleak picture especially when factoring in conflict intensity in the MENA Region with the potential multiplier effects of climate change, with this potentially giving impetus to conflict with fighting over scarce resources (see §2.3).
One of the many tensions that contributed to the Arab Spring were food shortages across the MENA region, particularly in Tunisia.[60] The political context in Syria reflected that of Tunisia, as did Egypt.[61] With these areas becoming increasingly arid and expected to experience even less precipitation due to climate change, the intensity of conflict should be cause for concern, especially considering for example Syria’s low score in the Layer Two precipitation sub-domain (which here can be conceptualized as low precipitation and more dryness) and high score in the Layer Two land sub-domain. Moreover, few countries in the MENA region have the funds to combat and mitigate the impact of conflict, as well as environmental stress.[62] An example is Yemen, which is currently hosting an unprecedented insurgency between the Shia and Sunni factions, experiences high levels of water stress, and ranks sixteenth overall in Layer One.[63] If the environmental situation worsens, the level of conflict intensity is likely to increase (see §2.2). Considering Yemen’s high score in Layer One, and its medium to high score in Layer Two, coupled with its weak level of Economic Resilience, our monitor illustrates the overall vulnerability of the Yemeni state and it’s dire need for a broad agenda in combating climate change.[64]
Consideration two – government effectiveness in Sub-Saharan Africa
Most African countries score high in the Layer One political sub-domain (see online Monitor). Much of this is attributed to the volatile nature of politics in Africa, where regime change, post-colonial political tensions and coup d’états (successful or unsuccessful) have significant impacts on the overall degree of conflict vulnerability on the continent. Stability, which is equated here with low/no vulnerability, is difficult to achieve in African politics due to the lack of social cohesion among the population barring different ethnicities and subsequently, different factions.[65] As a result of regime change, which is calculated in the Polity4Score and the Political Variance, lack of social cohesion can be identified quite frequently.[66] Some countries experience very few changes, and have (statistically) low/no variance. An example of this would be Russia and China, with the latter having no variance owing to the dominance of the communist party, illustrating that undemocratic states could perform quite well in the political sub-domain.
Looking at Layer One, it is evident that Sub-Saharan Africa is vulnerable to conflict, and is most predominantly vulnerable in the political sub-domain (Layer One). Taken in relation with other layers, this could prove problematic considering the conversation of economics of planetary security.[67] It is evident from the consolidated resilience monitor that Sub-Saharan countries fare worse. Most countries in Sub-Saharan Africa have received funding from the World Bank and the International Monetary Fund, in the form of sectoral adjustment programs and through the Comprehensive Development Framework, owing to their lack of domestic mechanisms to generate revenue. With many local actors competing for influence in order to promote particularistic agendas, a portion of the population will always have their interests ignored, and this will likely continue to be the case due to the lack of democratic mediums in these countries. Therefore, from a political perspective, the lack of social cohesion is one of the main motivators of conflict.[68]
It is evident that in Sub-Saharan Africa, countries (and especially land locked countries) are less prone to conflict deriving from environmental stress, as much of the region scores low or medium in the Climate Change Vulnerability Layer. This is not to discount the possibility of environmental stress induced conflict but merely to articulate to policy makers where the emphasis in a broad agenda should be. The priority of countries should be to implement a stable platform upon which policies can be implemented. This implies that conflict is more likely to emanate from ethnic and political difference which may cause a mismanagement of resources, as opposed to being motivated directly from the climate (see §2.2). Essentially, environmental stress, if properly managed through more effective governments, can be mitigated as a threat multiplier (see §4.1-4.6).
Case study Somalia
Somalia offers an interesting case as it scores highly in conflict vulnerability, climate change vulnerability and economic resilience but is the country with the lowest carbon risk. Somalia is ranked highest in Layer One, ranked tenth in Layer Two, and ranked second in Layer Three, but ranked last (lowest) in Layer Four. In Layer One, this is not entirely surprising considering it has one of the top three scores in two of the sub-domains (security and political). In Layer Two, much of Somalia’s climate change vulnerability stems from its low levels of precipitation and its large composition of desert. Much of the conflict in Somalia has been inspired by ethnic conflict and disagreements between the Islamists and the federal government in Mogadishu.[69] If climate change were to act as a multiplier threat this may prove to be a cause for concern as much of the conflict has been fought on political and ethnic lines. If resources and water were to continue to be in low supply, future conflicts may be fought over physical resource scarcity. With Somalia being one of the highest refugee producing nations, coupled with the lack of conflict on resources in the region (at least as a prime instigator), future causes of conflict may be more complex than contemporary ones.
Moreover, with the lack of a formal market and economy on the whole, Somalia scores quite high in economic resilience. Admittedly, there is missing data on Somalian debt, credit rating and economic freedom. This amounts to low – if any – economic resilience to climate change conflict; however, due to the lack of a formal market, Somalia subsequently has the lowest carbon risk.
The interplay with the four different layers presents Somalia as a conundrum to policymakers. With the lack of a strong domestic core of government and government actors, whether or not the Somalian Federal Government can implement change is cause for concern. Furthermore, with Somalia already highly vulnerable to conflict, increases in environmental stress can have severe implications on its population, as it is more prone to violence or escalation of existing tensions (see §2.3). In mitigating both conflicts induced by political, social and security factors, and by climate change, the present government does not have the means to do so successfully.
Layer Two: Climate Change Vulnerability Analysis
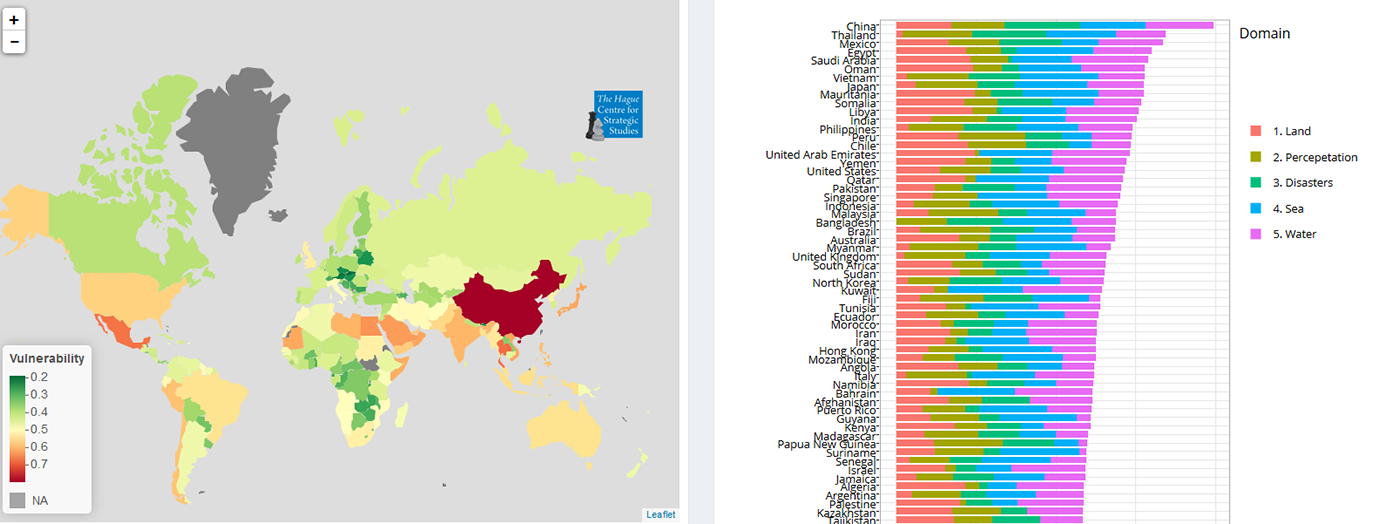
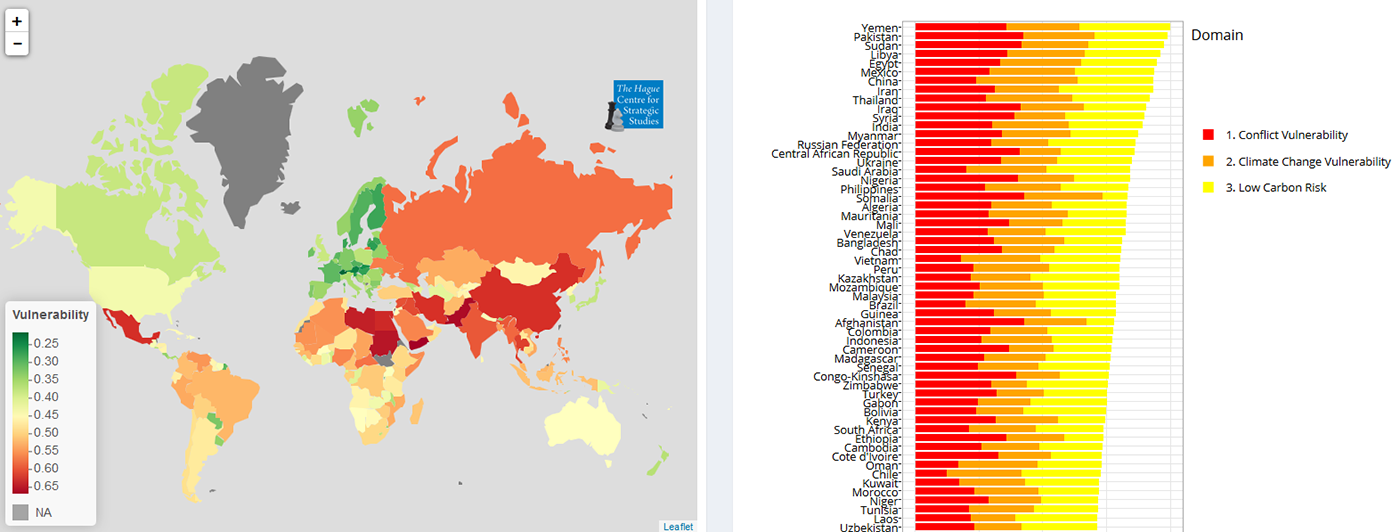
Figure 1 shows that there are more regional variations in Layer Two in comparison to Layer One. One remarkable feature of Layer Two is how well landlocked countries perform. Overall, landlocked countries in Asia, Africa, Europe and South America all score quite low, with Kyrgyzstan, Tajikistan, Austria, Switzerland, Rwanda, Zambia, Bolivia and Paraguay producing low scores in their respective continents. Africa, on the whole, seems to performing quite well with several countries in the high vulnerability range. Those which perform worse are often countries in the Sahel region or in the Horn of Africa – due to the lack of precipitation and expansiveness of deserts in the area. European countries all range in the very low to medium areas, with the exception of Italy and the United Kingdom and Northern Ireland.
Asia contains the most diverse range of scores with northern Asian states scoring low, and with Southern Asia scoring high, especially China and Thailand. North America region varies too, with the USA and Mexico being the most vulnerable states. The USA – owing to its geographic location and physical endowment – is vulnerable to a wide variety of different indicators in Layer Two. South America mirrors Asia’s diversity with Chile and Brazil scoring the highest in those areas, notably due to Chile’s Atacama Desert and water stress, and Brazil’s volatile precipitation.
Top Ten: Countries ranked most vulnerable
|
Rank |
Country |
Score |
|---|---|---|
|
1 |
China |
0.796 |
|
2 |
Thailand |
0.676 |
|
3 |
Mexico |
0.669 |
|
4 |
Egypt |
0.64 |
|
5 |
Saudi Ara |
0.632 |
|
6 |
Oman |
0.622 |
|
7 |
Vietnam |
0.622 |
|
8 |
Japan |
0.621 |
|
9 |
Mauritania |
0.619 |
|
10 |
Somalia |
0.614 |
From the top ten it is evident that China is by far the most vulnerable country in Layer Two, with a 0.12 increase over Thailand. China is ranked highly mainly due to their demography, diverse geography and topography, allowing them to score high in a range of indicators, especially in the water, sea-level and disaster domains. To that end, considering that the disaster domain largely depends on the number of individuals impacted by disasters and that China has the largest population in the world, especially in the South East of the state, it is not surprising it performs poorly in this layer.
From the data it is evident that most of these countries are either vulnerable due to their location in the tropics and the subsequent effects of precipitation, location of their main demographic, vulnerability to disasters, or cover large swathes of desert. For instance, Oman, Somalia, Saudi Arabia and Egypt, score highly in the land domain. Egypt and Vietnam occur in the top ten mainly due to the former’s size of desert and arable land coupled with the number of people living below 5 meters above sea-level, and the latter’s similarly low lying populations.
Bottom Ten: Countries ranked least vulnerable
|
Rank |
Country |
Score |
|---|---|---|
|
1 |
Rwanda |
0.192 |
|
2 |
Slovakia |
0.2 |
|
3 |
Luxemborg |
0.201 |
|
4 |
Austria |
0.212 |
|
5 |
Bhutan |
0.234 |
|
6 |
Czech Rep |
0.239 |
|
7 |
Hungary |
0.245 |
|
8 |
Belarus |
0.248 |
|
9 |
Mauritius |
0.253 |
|
10 |
Bulgaria |
0.269 |
A distinct trend from the bottom ten – the least vulnerable countries – in Layer Two is the fact that all these countries are land locked (with the exception of Bulgaria and Mauritius) and that they are relatively flat or small countries. Bearing in mind the conceptualization of the variables as outlined in §5.4, the fact that they are land-locked has two important implications: it usually means that most of the population lives above the 5 meters sea-level threshold, and that they are less likely to endure other coastal disasters or threats. For instance, eight out of the ten countries score zero in the sea sub-domain, implying that small numbers of the population live below sea-level, or none at all (this depending on the normalization of the data). Seven out of the ten countries are European, which may be a result of the widely accessible arable land in central Europe.
The variation among the top four is not too high, with the scoring being relatively close. Rwanda is an exceptional case, mostly owing to its low scoring in the land, disaster and sea sub-domains. This highlights that there is low environmental stress in the country.
Consideration three - disaster related risks and the ensuing instability
|
Rank |
Country |
|---|---|
|
1 |
China |
|
2 |
Thailand |
|
3 |
Guatemala |
|
4 |
Bolivia |
|
5 |
Mexico |
|
6 |
Bangladesh |
|
7 |
Somalia |
|
8 |
Paraguay |
|
9 |
Pakistan |
|
10 |
Philippines |
Disasters can have enormous ramifications on the well-being of a state. As stated earlier, disasters can result in the destruction of infrastructure (see §3.1), facilities and homes, and consequently disrupt social and economic developments, halt financial markets and may lead to many casualties among a country’s population. This is mainly why the discourse on climate change as a threat multiplier has become increasingly important in today’s world, and why taking the different indicators together offers new insight into the potential instability which might come with climate change. Most of the countries in the top ten disaster domain are countries that already endure various social, economic and political challenges and are relatively vulnerable to climate change in general. The impact of disasters in these areas can therefore catalyze conflict vulnerability, especially in Pakistan and Somalia, where little domestic infrastructure is present to counter these climate change induced disasters.[70]
Linking disaster related risks to conflict vulnerability has not been systematically done in previous climate change literature; however, this list of countries further inspires this link, considering that many of these countries either have a high population or densely populated urban areas. In the case that these areas are hit by disasters, the subsequent social upheaval could render much of the population more vulnerable to conflict and instill popular discontent with the status quo.[71] In the long term, in times of desperation, as in Somalia and Pakistan, extremist groups can exploit the new status quo by recruiting victims of these disasters with the promise of supplying them basic essentials. This can present political opportunities for not only engaging in more conflict, but disasters can act as scapegoats for political motivations and objectives, such as increasing military expenditure, relocating troops to sensitive areas, or by redirecting aid for self-enrichment.[72]
This relationship illustrates the importance of creating an integrated approach to combating climate change, and in this case, disasters caused by climate change.[73] Fortunately, with the exception of Somalia and Pakistan, most of these countries score in the medium range in the Conflict Vulnerability Layer. There are only a few cases where disasters have, indeed, assisted peacebuilding, resulting in some resolutions of conflicts. Conflict vulnerability is also compounded by the occurrence of natural disasters, the misappropriation of aid, and/or the asymmetry that disasters may cause by impacting insurgencies differently. Conflict increases disaster risk by displacing individuals into areas which can be deemed more vulnerable to conflict. Another related disaster risk is the impact of disasters on the economy. In case a country is continuously challenged by disasters, its infrastructure will be undermined perpetually or will be in continual need of being repaired. The economic costs to do so requires development of economic resilience. The above discussion on the impact of conflict coupled with the impact of disasters highlights the importance of having a strong economic resilience agenda to help improve links between social and economic development, while bearing in mind the implications of the environment (see §4.3 & 4.5).
Consideration four - scarcity of land and water implications
The effects of arable land and water scarcity – as part of the land and precipitation sub-domains - can have severe implications on the well-being of a country (see §2.2). There is a large backlog of historical water conflicts extending back thousands of years. The Pacific Institute has documented (approximately) every water conflict since 3500 BCE.[74] Taking Layer One and Layer Two’s sub-domains of land and water, one can see that there are inherent risks that may result in water-related violence and conflict, as populations place pressure on scarce water resources. Many of these risks are materializing at the domestic level, between domestic actors, and at an international level - as proven with the recent River Nile water dispute. But some argue that the Arab Spring and the more recent upheavals in the Middle East are inspired by water scarcity.[75] As freshwater is vital, but is often unevenly distributed in the MENA region, its availability greatly impacts the quality of life of a country. In addition, creating a cost-effective water supply system is difficult to implement, more so when a country is engulfed in war.
|
Rank |
Country |
Water |
|---|---|---|
|
1 |
Kuwait |
0,984 |
|
2 |
United Arab Emirates |
0,969 |
|
3 |
Bahrain |
0,965 |
|
4 |
Saudi Arabia |
0,962 |
|
5 |
Yemen |
0,947 |
|
6 |
Pakistan |
0,936 |
|
7 |
Qatar |
0,935 |
|
8 |
Israel |
0,931 |
|
9 |
Singapore |
0,913 |
|
10 |
Jordan |
0,906 |
Out of the top ten countries with the highest water vulnerability, only two are located out of the Middle East, with Singapore and Pakistan ranked ninth and sixth respectively. It is often difficult to establish a direct relationship between climate change and armed conflict, however given the uncertainty in the region, and the lack of access to water and lack of domestic bodies of water, it is expected that water scarcity will act as a catalyst to further conflict and could lead to disruption of local businesses (see §2.2 & §3.1). It could also undermine the future long term economic resilience of a country to climate change. Lack of water coupled with conflict may lead to mass migration of the inhabitants of one country to another.[76] Alternatively, countries with a mismatch in water management may impact water reliant sectors, causing social unrest and tension in already vulnerable countries, potentially leading to higher market prices; however, the research into the migration-environment relationship is still nascent, meaning that further investigation into this field is needed.[77]
Layer Three: Carbon Risk Analysis
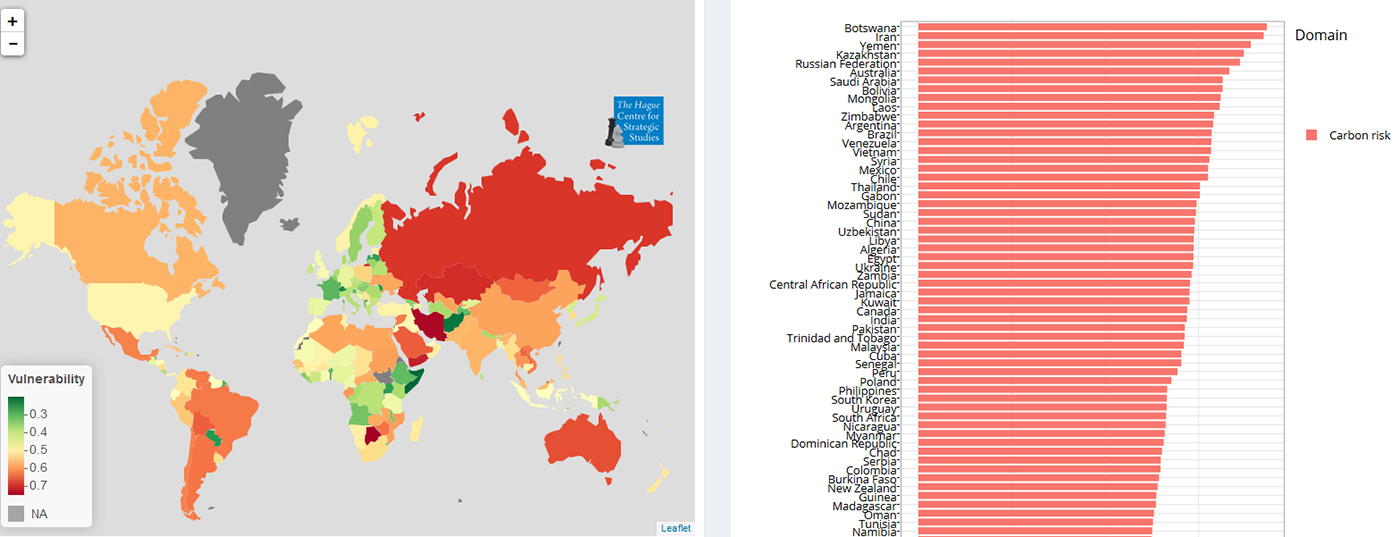
The overall pessimistic scores in Layer Three – especially in comparison to other layers – are unsurprising considering how non-renewable energy is still widely used and remains the major source of energy for many states (see §4.5). Figure 10 shows a global trend in dependency on the export of fossil fuels. An interesting caveat, however, is that most war torn countries such as Afghanistan, Somalia, Iraq and Pakistan seem to be faring relatively well, mostly in the low-risk to medium-risk range. Except for a few small enclaves in North America (such as Panama) and South America (such as Paraguay and French Guyana), the overall level of carbon risk is medium to high risk. Africa and Europe have the most optimistic scores of carbon risk. In the former, the Horn of Africa surprisingly has the best regional performance of any region around the world. In contrast, Northern Africa, with their reliance on oil exports, scores in the high risk range. This trend continues across the Sahara and into the Najd region, with Saudi Arabia and Yemen having high-risk scores.
In Europe, the reliance on carbon energy in Ukraine (gas) and Poland (coal) is evident, as they act as the only outliers in the overall European trend. The United Kingdom, Norway and Germany are at medium risk, but this should not be problematic considering they each possess a high level of economic resilience (as explained in Layer Four), meaning their transition into a low carbon economy may be smoother than anticipated and may already have policies in place to do so. In general, however, Asia performs quite poorly. Many of the larger countries such as Kazakhstan, Russia, Mongolia, India and China score high with carbon risk. Regionally, South East Asia seems to buck this trend, but still performs poorly considering most countries score in the medium risk range.
Top Ten: Countries with the highest carbon risk
|
Rank |
Country |
Score |
|---|---|---|
|
1 |
Botswana |
0.746 |
|
2 |
Iran |
0.739 |
|
3 |
Yemen |
0.711 |
|
4 |
Kazakhstan |
0.697 |
|
5 |
Russia |
0.688 |
|
6 |
Australia |
0.666 |
|
7 |
Saudi Arabia |
0.652 |
|
8 |
Bolivia |
0.651 |
|
9 |
Mongolia |
0.647 |
|
10 |
Laos |
0.645 |
The variation among top ten countries does not seem to be too extreme; however, Botswana and Iran seem to be considerably ahead of third placed Yemen, with an increase of 0.03 and 0.02 carbon risk respectively. It is relatively surprising for Botswana to have the highest score in carbon risk, especially considering how well it performed in the other three layers, having very desirable scores in all the layers. This suggests that a high carbon risk score may not be entirely problematic should the country seek to transition into a low carbon economy. For policy makers, this may present itself as an opportunity in helping a less economically developed country transition to more renewable energy with a continental backdrop like Africa.
With the exceptions of Botswana, Australia and Bolivia, there is a strong Asian representation here. The appearance of Russia and Saudi Arabia is partly due to their respective export of natural gas and oil, with both nations heavily dependent on these export industries. These two nations may experience severe difficulties in their transition towards a low carbon economy due to their historical reliance on these industries, the vast reserves and physical endowment of these countries based on these energies, and the change of business culture associated with these industries. Additionally, developing countries may have greater opportunities to design their economy on a low carbon risk base. Yemen, however, may experience difficulties in such a transition due to the current ongoing conflict, the lack of natural resources and its relative isolation from (international) financial investments.
Bottom Ten: countries with the lowest carbon risk
|
Rank |
Country |
Score |
|---|---|---|
|
1 |
Somalia |
0.201 |
|
2 |
Afghanistan |
0.219 |
|
3 |
Switzerland |
0.239 |
|
4 |
Moldova |
0.258 |
|
5 |
Paraguay |
0.259 |
|
6 |
Uganda |
0.264 |
|
7 |
Latvia |
0.266 |
|
8 |
Comoros |
0.284 |
|
9 |
Slovenia |
0.297 |
|
10 |
France |
0.300 |
The appearance of Somalia and Afghanistan paints a less grim overall picture of the two nations considering their high scores in other layers. Their appearance here can be attributed to the lack of domestic infrastructure geared towards producing and harnessing non-renewable energy or their low producing formal economies. This pitfall can be linked to how conflict has mitigated any form of economic development, which is per se undermined by the overall lack of funds in their respective economies. This illustrates the intimate relationship between non-renewable energy, development and economic resilience, as many developing nations equate using non-renewable energy as a key ingredient in developing their economic resilience. Moreover, there is a lack of regional dominance in the bottom ten, which is indicative of the global diversity when it comes to energy (or the lack thereof).
Consideration five - implications of carbon on economic resilience
Transitioning to a low carbon economy is both an opportunity and a challenge to policymakers and the private sector alike. An integral facet of low-carbon solutions is the manner in which they are commercialized, as this can help catalyze emerging markets and support the diversification of the international energy sector. An obstacle in the effectiveness and wide-reaching acceptance of climate change policy is the lack of alignment between various climate change policies and transitioning towards low-carbon economies, with this misalignment often unidentified or left unaddressed.[78] The implications of this on economic resilience is great, as economic resilience can be geared on the basis of both enhancing the economic capability to mitigate environmental stress and the multiplier threats from which it is derived.
For policy makers there seems an eternal paradox between the need for rapid response and urgent action towards climate change effects, and the fear of higher costs involved in a transition to a low carbon economy (resulting in slow economic development). If anything, the relationship between Layer Three and Layer Four indicates that these need not be mutually exclusive. This, however, should present itself as an investment opportunity to businesses to commercialize low-carbon solutions. Take, for instance, the case of Botswana, which has low conflict vulnerability, relatively low climate change vulnerability, strong economic resilience and high carbon risk. Nevertheless several issues need to be balanced out to ensure that stability and social well-being will be maintained.[79] While transitioning to a low-carbon economy would mean that Botswana is deprived of its main source of income – as it is evidently dependent on fossil fuel rents – there is a lack of domestic instability and conflict potential. Botswana, as an African case, can integrate these elements together and should aspire to diversify its economy to non-fossil fuel industries.[80] The funds generated by exporting fossil fuels could feed into the funding of non-fossil fuel industries, which, over time, would be rapidly phased out.[81]
Consideration six - fossil fuel dependency and armed conflict
As stated earlier in §3.2, countries such as Venezuela, Libya and Iraq may find their dependency on fossil fuels to be a crucial ingredient in maintaining some form of domestic stability. Transitioning to a low-carbon economy might be undesirable not only due to the ensuing economic issues, but also due to how the reliance on a particular industry, and the social fabric thereof, maintains some element of domestic stability (see §2.3 and Consideration Five). Additionally, several countries in the Middle East possess high carbon risk, and portray strong economic resilience but have several conflicts on their doorsteps. An example is Saudi Arabia, which is placed seventh highest concerning carbon risk, possesses strong economic resilience, but is surrounded by countries scoring high on the Conflict Vulnerability Layer, notably Yemen. Decreasing water supplies and population growth are a few of the factors driving the current conflict in which Saudi Arabia is involved militarily.[82] This is very indicative of the conversation that revolves around the economics of planetary security. With the potential impacts of a more specific climate change policy on the various sensitive domains in a nation like Syria, a broader reform agenda is needed, one which combines, for example, the transition to a low-carbon economy with a long term decrease of dependence on fossil fuel rents after the resolution of domestic conflicts.
Case study China
China presents a unique example for the following reasons: it is the most vulnerable country to climate change, is remarkably domestically stable in spite of its undemocratic tendencies, has high economic resilience as the world’s second largest economy, and faces medium conflict risk. China is the largest emitter of greenhouse gases and recently agreed to ratify the Paris Agreement (on climate change).[83] This, coupled with China’s recent 13th five-year plan (March, 2016) in which greater environmental protection and a reduction of overall energy consumption were identified as key aims of the Chinese Government, could indicate a shift in China’s overall approach to climate change.[84]
Food security and water security are tied into a variety of cultural and political factors in China, with the increasing affluence of the Chinese middle class able to afford more and moving to urban areas, leaving the rural populations – especially in the north – with little nutritional security. Many areas in the south lay in low transition zones where water bodies, and consequently agricultural yield, are already being reduced by climate change.[85] Given its size, large population, and geographic/topographic diversity, China’s physical environment is complex. Recently, China has suffered from a rise in the number of extreme climate conditions. Again, the south has experienced extremely high temperatures and an increase in floods, mudslides and landslides, especially in the Yunnan Province. Coastal economic hubs in the east have also been facing an increase in storm-related activity.[86]
With China beginning to shift its attitude towards climate change, a transition to a low-carbon economy will be crucial in China’s development and modernization. Such a transition would present opportunities for China to diversify its economy and strengthen its energy security. Its current, heavily polluting economic model is clearly unsustainable, and given the high economic resilience and low conflict vulnerability, China has the funds and relatively stable social climate to undergo such a transition. This is not only desired by Government officials, but locals in both rural and urban areas, as many feel their quality of life has been affected by the environmental pollution that has been instigated by China’s current economic model.
Layer Four: Economic Resilience Analysis
The overall pessimistic scores in Layer Three – especially in comparison to other layers – are unsurprising considering how non-renewable energy is still widely used and is still the major source of energy to many states (see § 4.5). This shows a global trend in dependency on the export of fossil fuels; however, in the case of economic resilience, this report emphasizes the ease and attractiveness of investing into these countries for private entities. Firstly, Europe presents us with a relatively mixed picture where Mediterranean Europe does not seem to be performing as well as its Northern (particularly Scandinavian) counterparts, partly explained by their domestic deficits. Nevertheless, as a whole, Europe is performing quite well, with Greece and Ukraine as the only outliers. Asia, however, has differing results in South East Asia, while the Gulf and Eastern Asia are performing generally well (with the strong exception of North Korea). Southern Asia and the central region score quite regularly in the medium to low range.
Africa is less resilient overall, with high scores in low resilience around the continent, with the exception of a few Southern African states such as Namibia, Botswana and South Africa, and remarkably, Libya. South America too presents a wide range of scores, with some countries scoring high in terms of economic resilience, such as Chile, Peru, Colombia and Uruguay, and others quite low in terms of economic resilience, such as Venezuela and Argentina. North America, however, seems to be performing quite well, with the strong domestic economies of the USA, Canada and Mexico painting a more positive picture on the continent. Furthermore, Australia and New Zealand both score quite well on the economic resilience scale.
Top Ten: Countries with the least economic resilience
|
Rank |
Country |
Score |
|---|---|---|
|
1 |
North Korea |
0.952 |
|
2 |
Somalia |
0.941 |
|
3 |
Sudan |
0.866 |
|
4 |
Cuba |
0.83 |
|
5 |
Guinea-Bissau |
0.822 |
|
6 |
Afghanistan |
0.818 |
|
7 |
Lao |
0.814 |
|
8 |
Mozambique |
0.811 |
|
9 |
Central African Republic |
0.788 |
|
10 |
Zimbabwe |
0.781 |
The top ten here represents the least economically resilient countries. As mentioned earlier, the inverse of the final economic resilience scores were taken in order to conceptualize a high score as an undesirable trait (see §5.6). Somalia, again, features in the top ten, coming in second after North Korea. The variance across the data is quite high, with North Korea and Somalia considerably less economically resilient than third placed Sudan. Other nations such as Cuba and Lao have socialist and protectionist elements to them too: the isolationism of North Korea, Cuba and Lao naturally results in low economic resilience as all of the indicators are conceptualized from a capitalist perspective, which also partially explains why African countries also seem to perform quite poorly in terms of economic resilience. Afghanistan and Sudan, as conflict zones, score quite highly partially due to the sanctions placed on the respective states, and due to their lack of interaction with the international economy. Domestically unstable countries seem to occupy various positions in the top ten as well, with Zimbabwe, Central African Republic and Mozambique occupying the last three positions. Overall, six of the final ten are African, indicating the lack of development on the continent as a whole.
Bottom Ten: countries with the most economic resilience
|
Rank |
Country |
Score |
|---|---|---|
|
1 |
Luxembourg |
0.094 |
|
2 |
Macao |
0.127 |
|
3 |
Switzerland |
0.138 |
|
4 |
Norway |
0.142 |
|
5 |
Estonia |
0.145 |
|
6 |
Hong Kong |
0.160 |
|
7 |
Sweden |
0.161 |
|
8 |
United Arab Emirates |
0.164 |
|
9 |
Saudi Arabia |
0.170 |
|
10 |
Australia |
0.174 |
These are the most resilient countries, with Scandinavian countries performing quite well, possibly due to their high economic freedom scores and high credit rating, with the European debt crisis having not impacted Scandinavian states as severely as first predicted in 2008. All of these states have high GDP per capita. Saudi Arabia’s appearance is largely due to their lack of debt. Hong Kong, Macao, Luxembourg and Estonia are ranked high predominantly due to their small country size and, more importantly, due to their dynamic and service driven economies.
In conjunction with Layer Three, four of these countries have high economic resilience and high carbon risk. For instance, Saudi Arabia, Australia, Norway and United Arab Emirates are all highly dependent on oil and fossil fuels as drivers of their economies and domestic energy industries. This may indicate that the transition from a carbon reliant economy to a low carbon economy may be affordable, but also more problematic.
Consideration seven - the role of economic resilience in conflict-vulnerable states
With many states scoring high in both conflict vulnerability and economic resilience (a high score denoting low resilience) it is important to look into the possible considerations for these countries. In the MENA region, with the exception of the oil rich states, many countries are caught in conflict and cannot maintain the stability needed to develop their economic resilience. How do less resilient countries get out of this rut? It is imperative to understand this dynamic, especially considering how climate change can potentially worsen the status quo if the conflict is not addressed first.
Economic resilience as a contributing factor to peace is, in essence, a domestic orientation of conflict prevention. A key step in this direction is the domestic government’s ability to manage the process of transforming conflict into peace. With fragmented and disjointed responses of government, especially in Syria, Pakistan and Sudan, local capacities are often overlooked and subsequently under-strengthened.[87] Considering that most of the countries in the top ten either suffer from economic sanctions or a lack of interaction with the global economic system, domestic development remains unattainable if these countries are not further integrated into the international community.[88] Internationally, this presents itself as a conundrum: in the knowledge that these countries will experience some form of environmental stress – which, overtime, may worsen – and that these countries have a high degree of conflict vulnerability and a low degree of economic resilience, how can the international community assist these conflict nations in developing economic resilience? A cardinal reason why most of these countries have low economic resilience is merely because of their disconnect from the international financial system, either at their own accord – North Korea, Lao and Cuba – or by the international community itself through sanctions– Sudan, Afghanistan, Zimbabwe.[89]
|
Rank |
Country |
|---|---|
|
1 |
Japan |
|
2 |
Switzerland |
|
3 |
Germany |
|
4 |
Sweden |
|
5 |
USA |
|
6 |
Korea |
|
7 |
Finland |
|
8 |
Singapore |
|
9 |
Czech Republic |
|
10 |
Austria |
|
11 |
UK |
|
12 |
Slovenia |
|
13 |
France |
|
14 |
Hungary |
|
15 |
Netherlands |
|
16 |
Slovakia |
|
17 |
Ireland |
|
18 |
Denmark |
|
19 |
Israel |
|
20 |
Mexico |
Consideration eight - economic complexity and credit rating and the role of private investment
Economic complexity – which denotes the degree of economic diversification in an economy - is a crucial indicator in Layer Four as it shows what private entities may do if they aspire to invest in a country. The objective of this indicator is to explain the entire economic system and the parts involved, rather than as a mere sum of its parts.[90] Furthermore, complexity is an illustration of the various ways and economic means through which a state can respond to changes in environmental conditions. The greater your economic complexity, the greater a state’s capacities to respond to the effects of climate change are, as complexity relates to the diverse range of approaches and methods a state can take in mitigating climate change effects.
From the ranking it is evident that there is some form of regional bias in the states with the most economic complexity. These states are either European, North America (excluding the Caribbean and Central America) or South East Asian. From a private sector perspective, this allows businesses to not only ‘experiment’ in determining which adaptation action would be most appropriate, but also in finding which action would be the most cost effective.[91] However predicting the economic consequence of climate change effects and cost effectiveness is considerably difficult. The key here to countries with low economic resilience and economic complexity is how to adapt, and improve the sectors of economy upon which they are most reliant, as well as their ability to do so. For instance, farmers might switch to crops more tolerant to dry soil. Critically, however, this reliance on agriculture in less developed countries presents a conundrum, especially considering if these changes were to fail. An alternative viewpoint suggests that economic diversification is a key component of economic resilience as it will assist countries in the long term.
Discussion
So far, the model comprises a consolidated version of all the layers combined. This however excludes the ability to freely combine the different layers at the user’s will (in a quantitative sense). Nonetheless, the benefits of cross-comparing the different layers to policymakers and business professionals alike give insight into: how to manage expectations, where the emphasis in policy/business plan implementation should be, the necessary measures needed to develop a coherent policy, and, lastly, how policies or business plans should be divided into stages.
Consolidated Risk Monitor
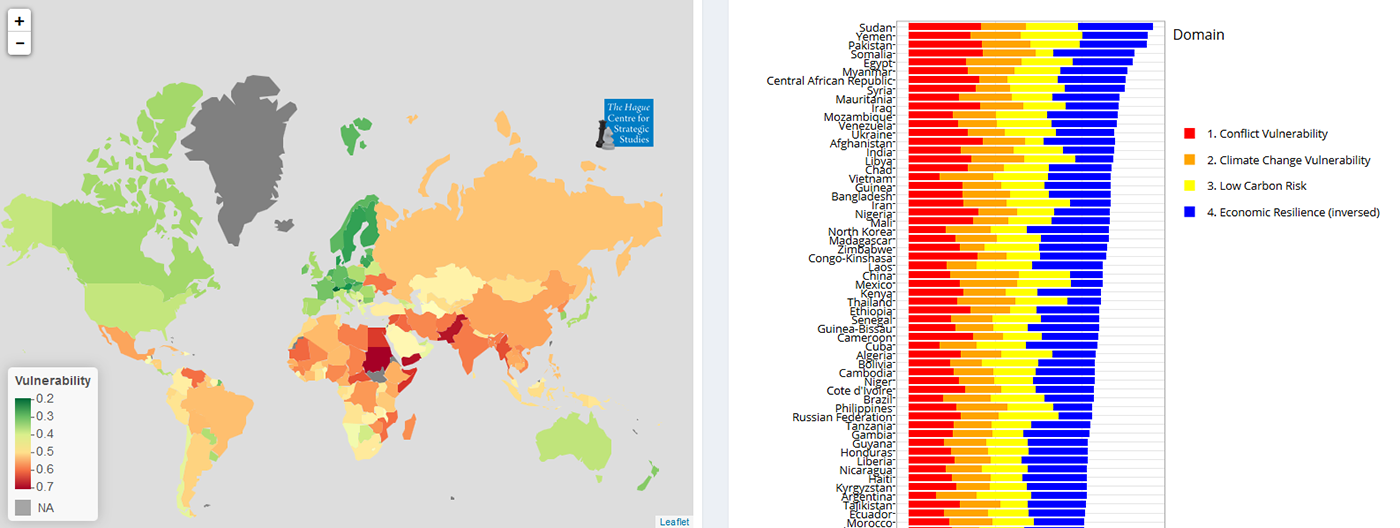
From the above image it is evident that Europe stands out as the least vulnerable continent (with the exception for Kaliningrad which scores in the high vulnerability range due to being Russian territory). Africa scores mostly on the medium to high vulnerability range, with the exception of North-Eastern Africa, which predominantly scores in the high vulnerability range. South America, with the exception of Paraguay (as a landlocked country), French Guyana[92] and Uruguay, have low vulnerability scores.
North America scores predominantly in the medium to low vulnerability range, with the exception of Mexico, which has a high vulnerability score. Meanwhile, Asia scores in the medium to high vulnerability range, with the exception of Japan and Bhutan. Oceania scores mostly in the medium to low vulnerability range.
Consolidated Resilience Monitor
The Consolidated Risk and Resilience Layer illustrates the degree of overall resilience to climate change effects. When reviewed against the Consolidated Risk Layer, the scores do not look quite so bleak: for instance, many states that are at risk have some economic capabilities to assist in mitigating such risks. With the exception of a few countries, the overall average score ranges in the medium mitigation range. With respect to the Consolidated Risk Layer, Asia fares better as it drops from being predominantly in the medium to high risk range to the medium risk range. This is, however, with the exception of Japan and South Korea, who both score low, and Pakistan and Yemen, who both score high. Africa continues this general trend, with most countries occupying the medium scoring range. Botswana is the only African state with a low score, indicating its overall ability to mitigate climate change based on the various layers. This bodes well considering its high dependence on fossil fuel rents. Sudan has the highest consolidated score.